
Type
News
Display start
Display end
News homepage item #
3
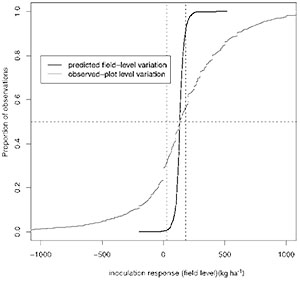
| The many on-farm trials implemented by N2Africa over the last six years provide a wealth of information on input responses across sub Saharan Africa. In a recently submitted study on soyabean we report on the patterns of inoculation response observed in a dataset of more than 2,000 trials, implemented in ten countries over six years. This study represents the largest effort so far to quantify the effect of inoculation as well as the variability in response at the plot and field level. We found that overall, inoculation increases yield by 115 kg ha-1, with seventy five percent of fields having predicted responses between 102 and 172 kg ha-1. Although this may seem to be a moderate gain, the low cost of inoculant means that the technology is predicted to provide economic benefits at 97 percent of fields. Twenty percent of fields would even be expected to have an added benefit of 100 USD ha-1 (Figure 1). These figures represent statistical predictions at the field scale, which correct for experimental error at the plot level. This experimental clearly affects individual on-farm comparisons between inoculated and uninoculated plots, and is therefore relevant to the experience of individual farmers with the technology. As can be seen from Figure 1, this observed plot-level variability in response is very large. This means that although many farmers will observe a benefit when comparing two experimental plots, almost 40 percent of farmers may observe responses below that would be considered economically beneficial. This result, clearly argues for the need for replication when demonstrating technologies to farmers, either by using multiple plots per farm or by taking farmers to see a number of demonstrations. Discussing both the mean effects and variations with farmers can provide a great way of helping farmers decide if a technology is appropriate for them. |
Figure 1. Cumulative distribution of predicted field-level responses (black) and observed responses at the experimental plot level (grey). Vertical dashed lines indicate the 25 kg ha-1 and 180 kg ha-1 points. The vertical dashed line marks the 50th percentile. |
Joost van Heerwaarden, Wageningen University & Research